What has Greespan said?
On Monday Feb 26, 2007, Greenspan said, “When you get this far away from a recession invariably forces build up for the next recession, and indeed we are beginning to see that sign”
Ex-Fed chief Greenspan says U.S. recession is possible by year-end
Extremely coincidentally, on Tuesday, the world markets dropped – Shanghai, US.
To probably remove himself from any association with the drop, he clarified himself on Thursday, “By the end of the year, there is the possibility, but not the probability of the U.S. moving into recession”
U.S. slump possible, not probable: Greenspan quoted
For those who speak Greenspanese, that might make sense. But for the rest of us mortals, it’s hard to make much sense of that. So, I guess to appease us, he later said that there is a 30% chance of a recession by the end of the year.
Also, when has Greenspan ever predicted, or even mentioned, a recession when he was the Federal Reserve chairman? None that I can find. So, I think the data would have to be pretty convincing if Greenspan was going to mention the “possibility” of a recession. And also, you generally want to get out of an organization one year ahead of when things hit the fan to avoid being blamed for it. So, it’s been a little over a year ago that Greenspan retired from the Fed Reserve.
So, just from analyzing Greenspan alone, there is a high likelihood of a recession coming.
What exactly is a recession anyways?
“A recession is traditionally defined in macroeconomics as a decline in a country’s real Gross Domestic Product (GDP) for two or more successive quarters of a year (equivalently, two consecutive quarters of negative real economic growth).”
“a significant decline in economic activity spread across the economy, lasting more than a few months.”
Wikipedia
Recessions are a normal part of the business cycle. Here is another chart.
What do others have to say about a possible recession?
Martin Weiss & Claus Vogt says, “So be sure to be ready for both: Recession AND inflation.” (Nov 13, 2006)
Brad Delong says “But there is a good chance – for the first time since 2003 – that there might be a recession in progress six months from now.” (Aug 7, 2006)
Roubini states, “I have also argued before that the effects of housing on US economic growth and the role of housing in tipping the US economy into a recession in early 2007 are more significant than the role that the tech sector bust in 2000 played in tipping the economy into a recession in 2001.” (Aug 23, 2006)
Econbrowser says, “Recent data leave me significantly more bearish than I was a month ago.” (Feb 28, 2007)
Tomnitz of D.R. Horton, says “I don’t want to be too sophisticated here, but 2007 is going to suck, all 12 months of the calendar year”
U.S. Stocks Decline Amid Concern About Housing; Treasuries Rise (March 7, 2007)
The Market Oracle says, “We believe ‘severe macroeconomic repercussions’ are highly likely and that ‘banking system capital’ will be impaired.” (Feb 5, 2007)
US Recession in 2007 – Third Leg of the Bear Market Likely
Tucker Hart Adams, says the “probability of an economic downturn at 75 percent and said the only question is “how hard the landing is going to be.” (Sept 12, 2006)
Dave Cohen says, “I shall argue from three separate lines of evidence indicating the possibility of a recession. Any one of them, by itself, might not be considered by some as sufficient reason for alarm. However, all three factors are strong signals and, taken together, paint a worrisome picture.” (Oct 4, 2006)
Paul Ashworth suggests “that early 2007 might be the right timing for a recession.” (Nov 28, 2005)
What is my prediction?
My guess is that all these people are probably understating what will happen. I think the stage is set for a severse recession, or even a depression, in the US. Pretty serious charges. But here is the data to back up my prediction.
Negative personal savings rate
“Americans� personal savings rate dipped into negative territory in 2005, something that hasn�t happened since the Great Depression … The savings rate has been negative for an entire year only twice before – in 1932 and 1933 – two years when the country was struggling to cope with the Great Depression, a time of massive business failures and job layoffs.”
U.S. savings rate hits lowest level since 1933
Since there is less money to go into savings accounts, banks need to raise savings rates to attract deposits. This contributes to the second indicator.
Inverted yield curve
“An inverted yield curve is uncomfortably predictive of future recessions: Japan’s yield curve was wildly inverted just prior to the collapse of the Nikkei and the long economic winter that followed; in America, six recessions since the 1960s have been presaged by inverted yield curves.”
Why Is The Yield Curve Inverted?
The reason that long term rates are low is that businesses and investors are interested in capital preservation. So the demand for long term bonds increases and drives down the rates. They would only do this if they believe that other investments (equity, equipment) would not be worth it. So they believe equities will be going down and demand for goods will be going down.
So, an inverted yield curve shows that people don’t have as much money, investors are shying away from stocks, and companies don’t want to spend much money.
Here are some real-time yield curve charts:
Stock Charts
Yield Curve
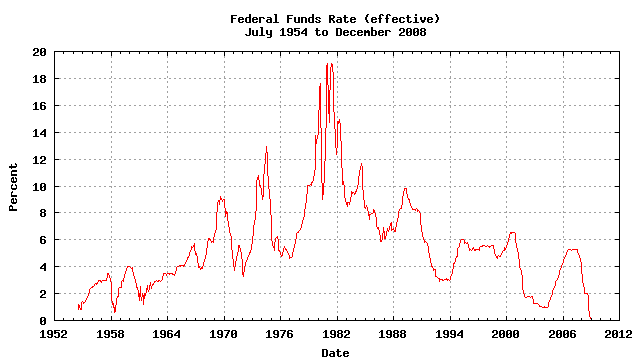
Rise of fed funds rate
The federal funds rate have been so low from 2002 – 2004 that it fueled the housing market bubble. So, it’s the beginning of the end of easy money.
Dive in factory orders
“The Commerce Department reported that total orders dropped by 5.6 percent in January, the biggest decline since July 2000, a period when the economy was slowing sharply in advance of an actual recession which began in 2001.”
Factory orders dive amid broad declines (Mar 6, 2007)
“In overall terms, manufacturing lost momentum in the second half of 2006, and is starting 2007 in a less than robust fashion. Also, results show a significant decline in the Inventories Index to the lowest level since February 2002, indicating that a significant liquidation is taking place in many supply chains. This is the largest month-to-month decrease since July/August 1984.”
January 2007 Manufacturing ISM Report On Business
Fall in Credit Manager’s Index
“The CMI data strongly suggests a slowing economy, and remains consistent with data from the rest of the macroeconomy indicating a slowdown – weak GDP growth for two consecutive quarters, durable goods orders (ex-transportation) falling for two second consecutive months, modest holiday sales and signs of weakness in the labor markets,”
U.S. credit index falls to lowest level since 2003
“The data suggests that businesses are curtailing their spending in anticipation of an economic slowdown”
NACM
Drop in dollar
“Investors worldwide are becoming sceptical and starting to pull their money out of the United States. They have realized that a people and a country cannot live beyond their means in the long term. The US dollar’s exchange rate is starting to crumble as a result of this withdrawal.”
How Dangerous is the Dollar Drop? (Dec 12, 2006)
“The dollar dropped sharply yesterday against a range of major currencies, with the euro breaking through $1.30 for the first time in a year and a half. The fall highlighted concerns about softness in the American economy as economies abroad continue to expand.”
Dollar’s value off, signaling concern (Nov 25, 2006)
“The financial press reported last week that the value of the U.S. dollar plummeted to a 14-year low against the British pound, and weakened against the Euro and Yen. Many financial analysts predict continued rough times for the dollar in 2007, given reduced expectations for economic growth at home and less enthusiasm among foreign central banks for holding U.S. debt.”
Monetary Inflation Is the Problem (Dec 5, 2006)
So even foreigners are anticipating a weakening of the US economy.
Collapse of subprime mortage market
“But now, some housing advocates contend, all that easy credit is on the verge of creating the worst mortgage crisis since the 1980s.”
Foreclosures rising among high-risk US mortgages (Mar 2, 2007)
“As federal regulators proposed changes to subprime lending, New Century Financial Corp. disclosed it is the subject of a criminal inquiry and Fremont General Corp. disclosed a cease and desist order and said it will exit subprime lending”
Subprime Storm Strengthens (Mar 5, 2007)
“We see increasing evidence that this industry is now in a downward spiral whereby each negative development fuels additional deterioration in key fundamentals including origination volume, pricing, credit and most importantly funding”
Lenders take beating in subprime fallout (Mar 5, 2007)
More news: Subprime Mortgage News
National Debt
This is what worries me the most.
As of March 8, 2007, the national debt was 8,833,183,947,747.23. That’s 8.8 trillion dollars. That means every single man, woman, and child’s share of the debt is $29,342.75. And this doesn’t include the Social Security and Medicare “trust funds”, which would probably add another 40 trillion dollars.


If there’s anything that would cause an instituion to implode, it would be massive debt.
David Walker, US Comptroller General, says “I would argue that the most serious threat to the United States is not someone hiding in a cave in Afghanistan or Pakistan but our own fiscal irresponsibility”
U.S. Heading For Financial Trouble? (Mar 4, 2007)
“To paraphrase the Oxford English Dictionary, is the United States at the end of its resources, exhausted, stripped bare, destitute, bereft, wanting in property, or wrecked in consequence of failure to pay its creditors”
US ‘could be going bankrupt’ (Aug 17, 2006)
“a federal debt burden that ultimately spirals out of control.”
Gov. auditor says fiscal outlook is ‘spiraling out of control’ (Feb 26, 2007)
Federal Budget Deficit
2003, -538 billion
2004, -568 billion
2005, -493 billion
2006, -434 billion
CBO
Record Personal Debt
In 2005, the average household credit card debt was $11,840.
Record Personal Debt ratio
Since 2005 Q2, the DSR (Debt Service Ratio) has been above 14%. And total FOR (Financial Obligations Ratio) has been above 19%.
Household Debt Service and Financial Obligations Ratios
More information: Grandfather Economic report